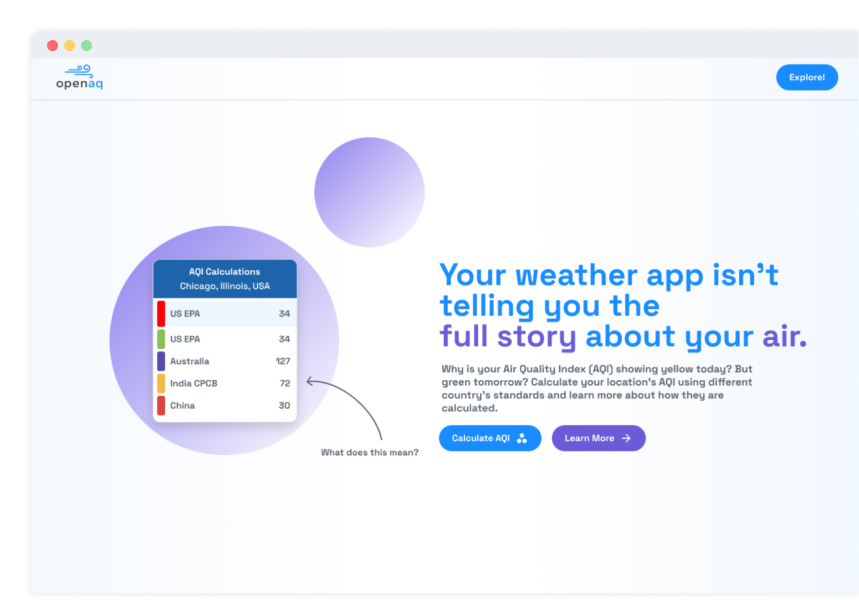
Problem
Different countries have varying methods and thresholds for calculating Air Quality Indexes (AQIs), leading to inconsistencies in how air pollution levels are communicated to the public. OpenAQ collects raw air pollutant concentration values, avoiding the inconsistencies of different AQI standards, but recognizes the need to provide a tool that can calculate multiple national AQIs from this raw data to provide a transparent solution to calculating these AQIs, enabling more literacy around the meaning and the strengths and weaknesses of using index values.
Solution
We worked with OpenAQ to build an interactive platform that empowers and educates users on AQIs so that they can make informed decisions for their health and well-being by providing transparency through calculations, as well as create a tool that compares and contrasts the differences in AQI measurements across different standards.
Design
Our users have varying levels of expertise in understanding AQI values. To accommodate this, we focused on creating an interactive slideshow that educates users on essential concepts and the significance of AQIs before they engage with our tool. This approach ensures that both novices and experts can have a seamless experience, as the tool is designed to be intuitive for beginners while still providing the depth needed for more experienced users.
Tech Stack
The OpenAQ AQI Comparison Tool is a front-end only project that utilizes SolidJS and Typescript. This tool interacts with several external APIs including the national weather service API, the mapbox geocoding API, and the OpenAQ air quality data API.
Features
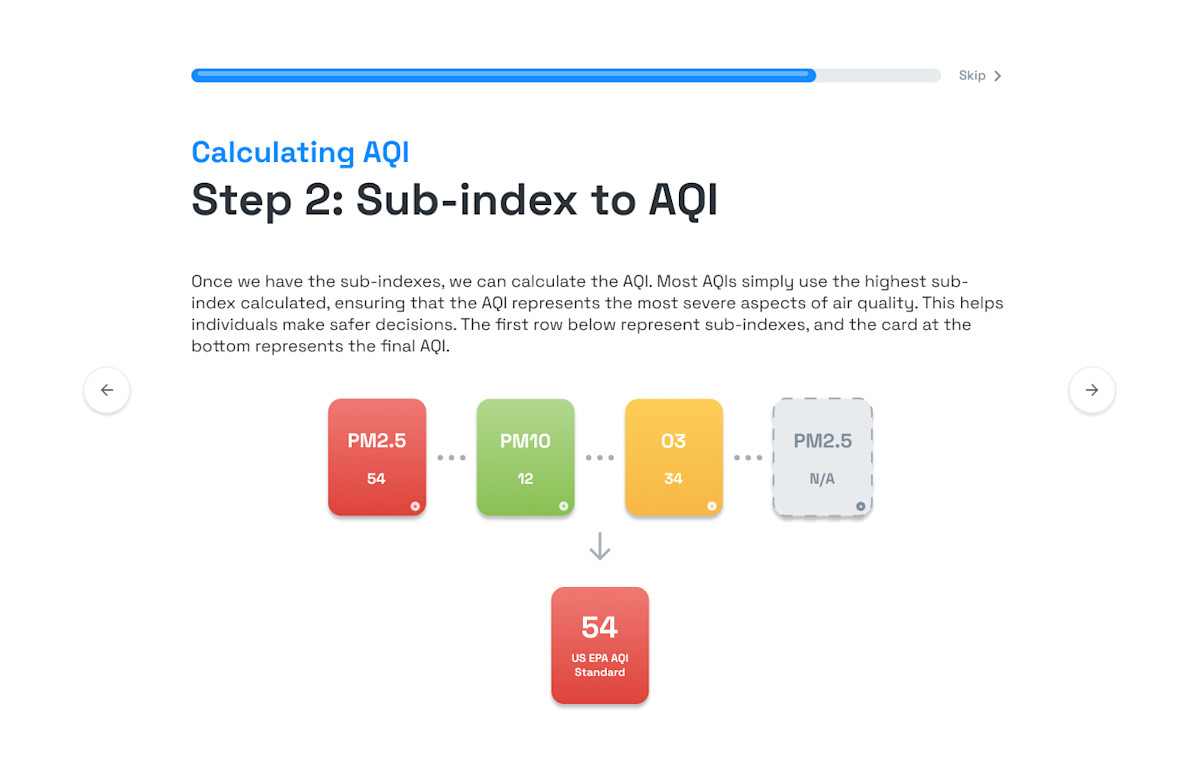
Informational AQI Slideshow
We built an interactive slideshow to educate users on AQIs, including information such as how AQI is calculated, how the role of pollutants are taken into account when obtaining final value, why understanding AQI is essential, and more.
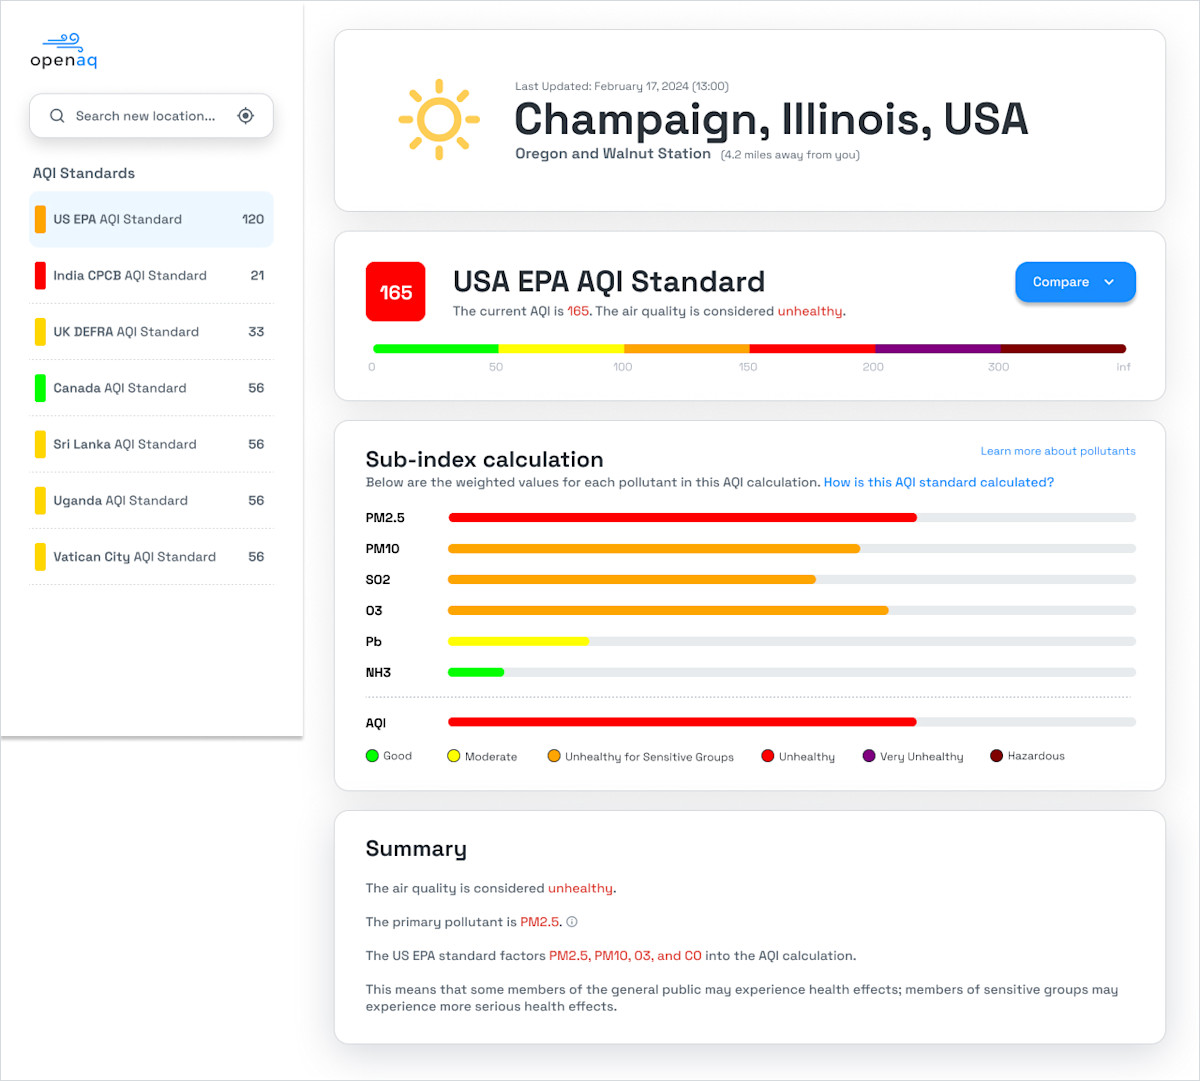
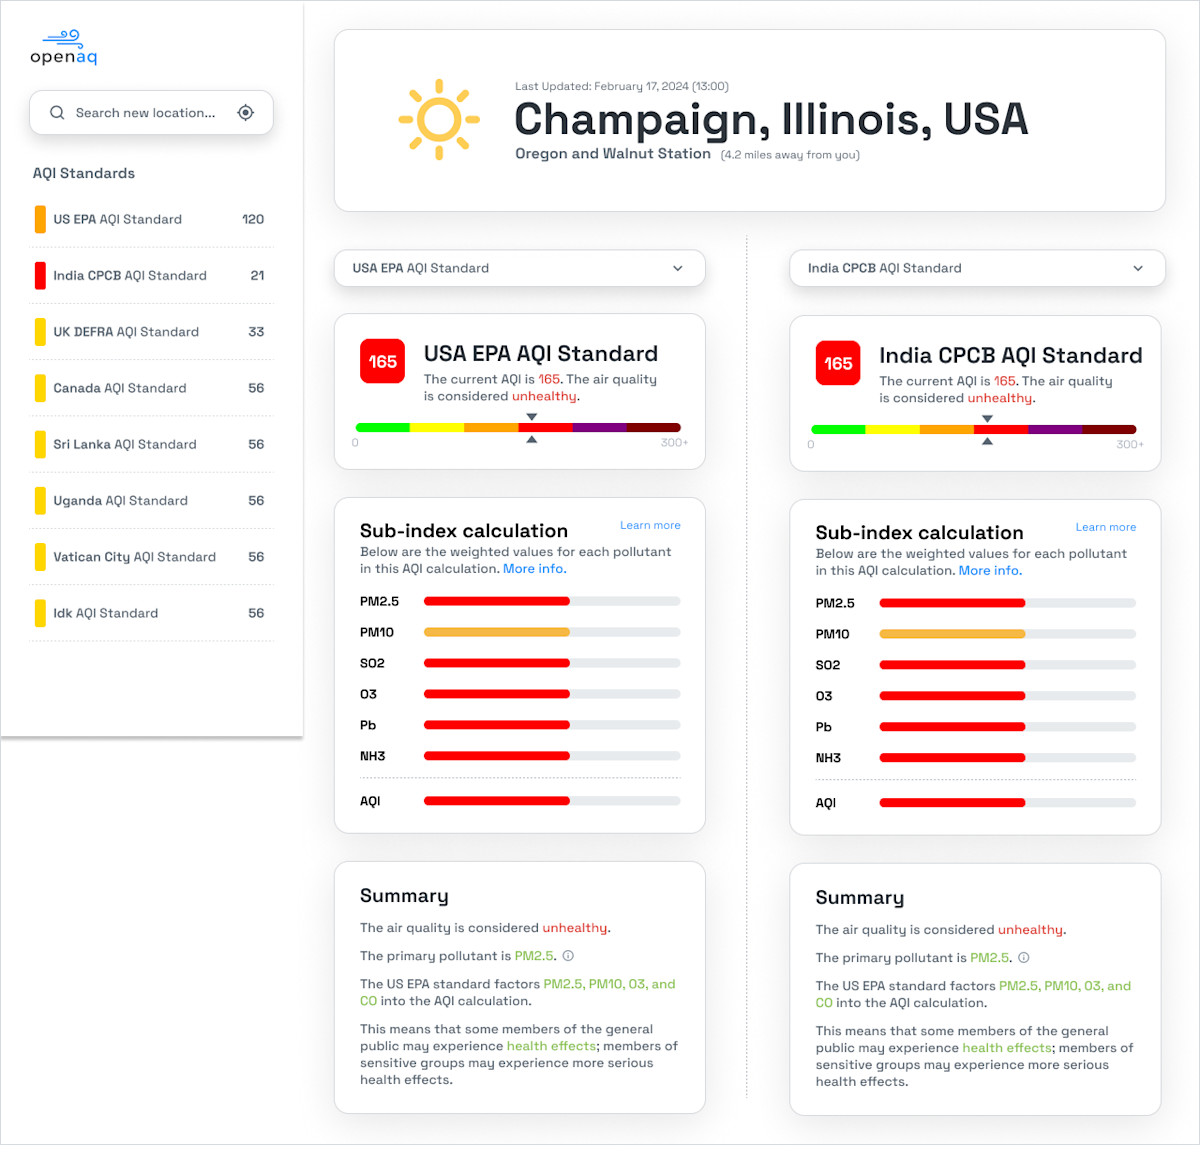
AQI Single Page Comparison Tool + Multiple AQIs
This page is used to educate the user on the location’s current AQI measurement, what pollutants were taken into account in the calculation, and which station the data was measured from, in addition to an over-arching summary. This allows the user to have a cohesive understanding of the AQI standard. We also included a compare button in order to calculate the current location data using a different standard to see how the values change.